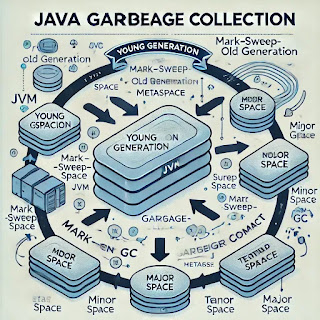
Java Garbage Collection and Its Types
Introduction
Memory management is a critical aspect of programming, and Java provides an automated system for managing memory allocation and deallocation through Garbage Collection (GC). The Java Virtual Machine (JVM) takes care of reclaiming unused memory, preventing memory leaks, and optimizing application performance. This article explores Java's garbage collection mechanism, the different types of garbage collectors, and best practices for efficient memory management.
What is Garbage Collection in Java?
Garbage Collection (GC) in Java is an automatic process that identifies and removes unused objects from memory, freeing up space for new objects. Unlike languages like C or C++, where developers must manually manage memory using malloc() and free(), Java automates this process through the Garbage Collector.
How Does Garbage Collection Work?
- Java objects are stored in the heap memory.
- The Garbage Collector continuously monitors memory usage and identifies objects that are no longer referenced.
- These unreachable objects are marked for deletion.
- The GC process removes these objects and reclaims the memory.
- The heap is compacted to optimize memory allocation.
Java Memory Management
Before diving into the types of garbage collectors, it is essential to understand the structure of Java's memory model.
JVM Memory Structure
Java memory is divided into different regions:
- Young Generation: Contains newly created objects.
- Eden Space: Where all new objects are allocated.
- Survivor Spaces (S0, S1): Objects that survive a garbage collection cycle move here.
- Old Generation (Tenured Space): Stores long-lived objects that have survived multiple GC cycles.
- MetaSpace (Method Area): Stores class metadata, method data, and runtime constants.
- Stack Memory: Stores method execution, local variables, and references to objects.
Types of Garbage Collectors in Java
Java provides multiple types of garbage collectors, each optimized for different use cases.
1. Serial Garbage Collector
- Uses a single-threaded approach.
- Best suited for single-CPU machines and small applications.
- Freezes application threads (Stop-the-world) during garbage collection.
- Enabled using:
-XX:+UseSerialGC
2. Parallel Garbage Collector (Throughput Collector)
- Uses multiple threads for garbage collection.
- Ideal for multi-core processors and applications requiring high throughput.
- Still causes Stop-the-world pauses but is more efficient than Serial GC.
- Enabled using:
-XX:+UseParallelGC
3. CMS (Concurrent Mark-Sweep) Garbage Collector
- Reduces application pause times by running garbage collection concurrently with the application.
- Works in four phases:
- Initial Mark – Identifies GC roots (short pause).
- Concurrent Mark – Scans the heap for live objects.
- Concurrent Sweep – Cleans up dead objects without stopping the application.
- Final Remark – Ensures missed objects are collected (short pause).
- Suitable for low-latency applications.
- Enabled using:
-XX:+UseConcMarkSweepGC
4. G1 (Garbage First) Garbage Collector
- Designed for applications with large heaps (multi-gigabytes).
- Uses a region-based heap structure rather than generations.
- Collects garbage in parallel, concurrent, and incremental cycles.
- Aims for predictable pause times.
- Enabled using:
-XX:+UseG1GC
5. Z Garbage Collector (ZGC)
- A low-latency GC that minimizes pause times (~1-2ms).
- Supports very large heaps (up to 16TB).
- Performs most of its work concurrently without stopping the application.
- Enabled using:
-XX:+UseZGC
6. Shenandoah Garbage Collector
- Developed by Red Hat for ultra-low pause times.
- Performs concurrent garbage collection similar to ZGC.
- Targets real-time applications requiring consistent performance.
- Enabled using:
-XX:+UseShenandoahGC
How to Monitor and Optimize Garbage Collection
1. Monitoring GC Performance
Use these tools to analyze garbage collection behavior:
jstat– Monitor GC statistics (jstat -gc <pid>)jvisualvm– GUI-based performance monitoring.- GC Logs – Enable with
-XX:+PrintGCDetails -Xlog:gc
2. Tuning GC for Performance
To optimize garbage collection, consider:
- Choosing the right GC based on application needs.
- Adjusting heap size using
-Xms(initial heap size) and-Xmx(maximum heap size). - Tuning survivor space with
-XX:SurvivorRatio. - Setting GC pause time goals using
-XX:MaxGCPauseMillis=<ms>.
3. Best Practices to Reduce GC Overhead
- Use object pooling for frequently used objects.
- Avoid excessive object creation within loops.
- Explicitly nullify large objects when no longer needed.
- Use primitive types instead of wrapper classes where possible.
- Optimize data structures (e.g., use
ArrayListinstead ofLinkedListwhen applicable).
Conclusion
Garbage collection is an essential feature of Java that simplifies memory management and enhances application stability. Understanding different garbage collectors and their optimizations can help developers fine-tune JVM performance and reduce memory-related bottlenecks.
By selecting the right GC strategy based on application needs and using best practices, Java applications can achieve optimal performance with minimal memory overhead.
What's Next?
Interested in diving deeper into Java performance tuning and JVM internals? Stay tuned for more advanced topics!
Sign up here with your email

ConversionConversion EmoticonEmoticon